


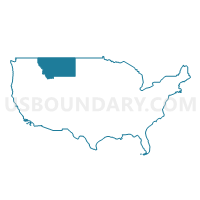
Census Tract 2, Sanders County, Montana
About
Outline

Summary
| Unique Area Identifier | 470512 |
| Name | Census Tract 2 |
| County | Sanders County |
| State | Montana |
| Area (square miles) | 1,166.21 |
| Land Area (square miles) | 1,147.87 |
| Water Area (square miles) | 18.35 |
| % of Land Area | 98.43 |
| % of Water Area | 1.57 |
| Latitude of the Internal Point | 47.82904210 |
| Longtitude of the Internal Point | -115.61856180 |
| Total Population | 5,988 |
| Total Housing Units | 3,547 |
| Total Households | 2,688 |
| Median Age | 50.4 |
Maps


Graphs
Select a template below for downloading or customizing gragh for Census Tract 2, Sanders County, Montana


Neighbors
Neighoring Census Tract (by Name) Neighboring Census Tract on the Map
- Census Tract 1, Sanders County, MT
- Census Tract 1, Lincoln County, MT
- Census Tract 5, Lincoln County, MT
- Census Tract 9501, Bonner County, ID
- Census Tract 9602, Shoshone County, ID
- Census Tract 9604, Shoshone County, ID
- Census Tract 9646, Mineral County, MT
Top 10 Neighboring County Subdivision (by Population) Neighboring County Subdivision on the Map
- Libby CCD, Lincoln County, MT (9,890)
- Thompson Falls-West End CCD, Sanders County, MT (5,988)
- Osburn-Wallace CCD, Shoshone County, ID (4,121)
- Troy CCD, Lincoln County, MT (3,576)
- Plains CCD, Sanders County, MT (3,544)
- Clark Fork CCD, Bonner County, ID (2,398)
- West End CCD, Mineral County, MT (1,216)
- Mullan CCD, Shoshone County, ID (766)
- Murray CCD, Shoshone County, ID (541)
Top 10 Neighboring Place (by Population) Neighboring Place on the Map
- Thompson Falls city, MT (1,313)
- Heron CDP, MT (282)
- Trout Creek CDP, MT (242)
- Noxon CDP, MT (218)
- Belknap CDP, MT (158)
Top 10 Neighboring Elementary School District (by Population) Neighboring Elementary School District on the Map
- Thompson Falls Elementary School District, MT (3,556)
- Troy Elementary School District, MT (2,850)
- Noxon Elementary School District, MT (1,421)
- Trout Creek Elementary School District, MT (1,130)
Top 10 Neighboring Secondary School District (by Population) Neighboring Secondary School District on the Map
- Troy High School District, MT (3,583)
- Thompson Falls High School District, MT (3,556)
- Noxon High School District, MT (2,551)
Top 10 Neighboring Unified School District (by Population) Neighboring Unified School District on the Map
- Lake Pend Oreille School District 84, ID (29,408)
- Libby K-12 Schools, MT (9,844)
- Wallace School District 393, ID (4,254)
- St. Regis K-12 Schools, MT (1,247)
- Mullan School District 392, ID (770)
Top 10 Neighboring State Legislative District Lower Chamber (by Population) Neighboring State Legislative District Lower Chamber on the Map
- State House District 1, ID (40,210)
- State House District 2, ID (35,917)
- State House District 2, MT (10,711)
- State House District 14, MT (10,552)
- State House District 13, MT (10,394)
- State House District 1, MT (8,976)
Top 10 Neighboring State Legislative District Upper Chamber (by Population) Neighboring State Legislative District Upper Chamber on the Map
- State Senate District 1, ID (40,210)
- State Senate District 2, ID (35,917)
- State Senate District 7, MT (20,946)
- State Senate District 1, MT (19,687)
Top 10 Neighboring 111th Congressional District (by Population) Neighboring 111th Congressional District on the Map
Top 10 Neighboring 5-Digit ZIP Code Tabulation Area (by Population) Neighboring 5-Digit ZIP Code Tabulation Area on the Map
- 59923, MT (9,856)
- 59935, MT (3,576)
- 59859, MT (3,270)
- 59873, MT (3,085)
- 83873, ID (1,591)
- 59874, MT (1,568)
- 83811, ID (1,411)
- 59866, MT (943)
- 83846, ID (770)
- 59844, MT (736)
Data
Demographic, Population, Households, and Housing Units
** Data sources from census 2010 **
Show Data on Map
Download Full List as CSV
Download Quick Sheet as CSV
| Subject | This Area | Sanders County | Montana | National |
|---|---|---|---|---|
| POPULATION | ||||
| Total Population Map | 5,988 | 11,413 | 989,415 | 308,745,538 |
| POPULATION, HISPANIC OR LATINO ORIGIN | ||||
| Not Hispanic or Latino Map | 5,907 | 11,180 | 960,850 | 258,267,944 |
| Hispanic or Latino Map | 81 | 233 | 28,565 | 50,477,594 |
| POPULATION, RACE | ||||
| White alone Map | 5,771 | 10,453 | 884,961 | 223,553,265 |
| Black or African American alone Map | 10 | 17 | 4,027 | 38,929,319 |
| American Indian and Alaska Native alone Map | 60 | 505 | 62,555 | 2,932,248 |
| Asian alone Map | 19 | 34 | 6,253 | 14,674,252 |
| Native Hawaiian and Other Pacific Islander alone Map | 1 | 1 | 668 | 540,013 |
| Some Other Race alone Map | 18 | 44 | 5,975 | 19,107,368 |
| Two or More Races Map | 109 | 359 | 24,976 | 9,009,073 |
| POPULATION, SEX | ||||
| Male Map | 3,112 | 5,852 | 496,667 | 151,781,326 |
| Female Map | 2,876 | 5,561 | 492,748 | 156,964,212 |
| POPULATION, AGE (18 YEARS) | ||||
| 18 years and over Map | 4,790 | 9,059 | 765,852 | 234,564,071 |
| Under 18 years | 1,198 | 2,354 | 223,563 | 74,181,467 |
| POPULATION, AGE | ||||
| Under 5 years | 284 | 582 | 62,423 | 20,201,362 |
| 5 to 9 years | 273 | 586 | 60,765 | 20,348,657 |
| 10 to 14 years | 336 | 664 | 61,124 | 20,677,194 |
| 15 to 17 years | 305 | 522 | 39,251 | 12,954,254 |
| 18 and 19 years | 120 | 213 | 27,473 | 9,086,089 |
| 20 years | 45 | 78 | 13,789 | 4,519,129 |
| 21 years | 33 | 79 | 13,517 | 4,354,294 |
| 22 to 24 years | 119 | 248 | 39,832 | 12,712,576 |
| 25 to 29 years | 231 | 432 | 64,123 | 21,101,849 |
| 30 to 34 years | 254 | 504 | 58,741 | 19,962,099 |
| 35 to 39 years | 261 | 516 | 55,575 | 20,179,642 |
| 40 to 44 years | 293 | 547 | 57,370 | 20,890,964 |
| 45 to 49 years | 403 | 773 | 71,021 | 22,708,591 |
| 50 to 54 years | 513 | 991 | 78,811 | 22,298,125 |
| 55 to 59 years | 624 | 1,124 | 75,915 | 19,664,805 |
| 60 and 61 years | 252 | 464 | 27,095 | 7,113,727 |
| 62 to 64 years | 348 | 634 | 35,848 | 9,704,197 |
| 65 and 66 years | 212 | 372 | 19,811 | 5,319,902 |
| 67 to 69 years | 301 | 523 | 26,745 | 7,115,361 |
| 70 to 74 years | 348 | 647 | 34,186 | 9,278,166 |
| 75 to 79 years | 209 | 385 | 25,637 | 7,317,795 |
| 80 to 84 years | 114 | 277 | 20,342 | 5,743,327 |
| 85 years and over | 110 | 252 | 20,021 | 5,493,433 |
| MEDIAN AGE BY SEX | ||||
| Both sexes Map | 50.40 | 49.80 | 39.80 | 37.20 |
| Male Map | 50.00 | 49.60 | 38.80 | 35.80 |
| Female Map | 50.90 | 50.00 | 41.00 | 38.50 |
| HOUSEHOLDS | ||||
| Total Households Map | 2,688 | 5,121 | 409,607 | 116,716,292 |
| HOUSEHOLDS, HOUSEHOLD TYPE | ||||
| Family households: Map | 1,766 | 3,204 | 257,087 | 77,538,296 |
| Husband-wife family Map | 1,537 | 2,704 | 201,611 | 56,510,377 |
| Other family: Map | 229 | 500 | 55,476 | 21,027,919 |
| Male householder, no wife present Map | 86 | 181 | 18,431 | 5,777,570 |
| Female householder, no husband present Map | 143 | 319 | 37,045 | 15,250,349 |
| Nonfamily households: Map | 922 | 1,917 | 152,520 | 39,177,996 |
| Householder living alone Map | 804 | 1,680 | 121,775 | 31,204,909 |
| Householder not living alone Map | 118 | 237 | 30,745 | 7,973,087 |
| HOUSEHOLDS, HISPANIC OR LATINO ORIGIN OF HOUSEHOLDER | ||||
| Not Hispanic or Latino householder: Map | 2,670 | 5,056 | 401,678 | 103,254,926 |
| Hispanic or Latino householder: Map | 18 | 65 | 7,929 | 13,461,366 |
| HOUSEHOLDS, RACE OF HOUSEHOLDER | ||||
| Householder who is White alone | 2,613 | 4,760 | 379,280 | 89,754,352 |
| Householder who is Black or African American alone | 5 | 8 | 1,245 | 14,129,983 |
| Householder who is American Indian and Alaska Native alone | 25 | 209 | 18,263 | 939,707 |
| Householder who is Asian alone | 6 | 12 | 1,909 | 4,632,164 |
| Householder who is Native Hawaiian and Other Pacific Islander alone | 0 | 0 | 231 | 143,932 |
| Householder who is Some Other Race alone | 4 | 15 | 1,889 | 4,916,427 |
| Householder who is Two or More Races | 35 | 117 | 6,790 | 2,199,727 |
| HOUSEHOLDS, HOUSEHOLD TYPE BY HOUSEHOLD SIZE | ||||
| Family households: Map | 1,766 | 3,204 | 257,087 | 77,538,296 |
| 2-person household Map | 1,109 | 1,934 | 129,321 | 31,882,616 |
| 3-person household Map | 303 | 566 | 52,940 | 17,765,829 |
| 4-person household Map | 180 | 344 | 43,033 | 15,214,075 |
| 5-person household Map | 110 | 216 | 20,021 | 7,411,997 |
| 6-person household Map | 35 | 86 | 7,461 | 3,026,278 |
| 7-or-more-person household Map | 29 | 58 | 4,311 | 2,237,501 |
| Nonfamily households: Map | 922 | 1,917 | 152,520 | 39,177,996 |
| 1-person household Map | 804 | 1,680 | 121,775 | 31,204,909 |
| 2-person household Map | 95 | 198 | 24,654 | 6,360,012 |
| 3-person household Map | 9 | 24 | 4,106 | 992,156 |
| 4-person household Map | 7 | 8 | 1,374 | 411,171 |
| 5-person household Map | 4 | 4 | 445 | 126,634 |
| 6-person household Map | 0 | 0 | 102 | 48,421 |
| 7-or-more-person household Map | 3 | 3 | 64 | 34,693 |
| HOUSING UNITS | ||||
| Total Housing Units Map | 3,547 | 6,678 | 482,825 | 131,704,730 |
| HOUSING UNITS, OCCUPANCY STATUS | ||||
| Occupied Map | 2,688 | 5,121 | 409,607 | 116,716,292 |
| Vacant Map | 859 | 1,557 | 73,218 | 14,988,438 |
| HOUSING UNITS, OCCUPIED, TENURE | ||||
| Owned with a mortgage or a loan Map | 1,076 | 1,958 | 171,236 | 52,979,430 |
| Owned free and clear Map | 981 | 1,886 | 107,182 | 23,006,644 |
| Renter occupied Map | 631 | 1,277 | 131,189 | 40,730,218 |
| HOUSING UNITS, VACANT, VACANCY STATUS | ||||
| For rent Map | 49 | 108 | 10,082 | 4,137,567 |
| Rented, not occupied Map | 3 | 10 | 773 | 206,825 |
| For sale only Map | 74 | 153 | 5,964 | 1,896,796 |
| Sold, not occupied Map | 32 | 37 | 1,353 | 421,032 |
| For seasonal, recreational, or occasional use Map | 513 | 864 | 38,510 | 4,649,298 |
| For migrant workers Map | 0 | 9 | 283 | 24,161 |
| Other vacant Map | 188 | 376 | 16,253 | 3,652,759 |
| HOUSING UNITS, OCCUPIED, AVERAGE HOUSEHOLD SIZE BY TENURE | ||||
| Total: Map | 2.21 | 2.19 | 2.35 | 2.58 |
| Owner occupied Map | 2.19 | 2.19 | 2.42 | 2.65 |
| Renter occupied Map | 2.26 | 2.20 | 2.18 | 2.44 |
| HOUSING UNITS, OCCUPIED, TENURE BY RACE OF HOUSEHOLDER | ||||
| Owner occupied: Map | 2,057 | 3,844 | 278,418 | 75,986,074 |
| Householder who is White alone Map | 2,013 | 3,614 | 263,920 | 63,446,275 |
| Householder who is Black or African American alone Map | 2 | 4 | 380 | 6,261,464 |
| Householder who is American Indian and Alaska Native alone Map | 18 | 139 | 8,800 | 509,588 |
| Householder who is Asian alone Map | 4 | 7 | 946 | 2,688,861 |
| Householder who is Native Hawaiian and Other Pacific Islander alone Map | 0 | 0 | 107 | 61,911 |
| Householder who is Some Other Race alone Map | 1 | 7 | 819 | 1,975,817 |
| Householder who is Two or More Races Map | 19 | 73 | 3,446 | 1,042,158 |
| Renter occupied: Map | 631 | 1,277 | 131,189 | 40,730,218 |
| Householder who is White alone Map | 600 | 1,146 | 115,360 | 26,308,077 |
| Householder who is Black or African American alone Map | 3 | 4 | 865 | 7,868,519 |
| Householder who is American Indian and Alaska Native alone Map | 7 | 70 | 9,463 | 430,119 |
| Householder who is Asian alone Map | 2 | 5 | 963 | 1,943,303 |
| Householder who is Native Hawaiian and Other Pacific Islander alone Map | 0 | 0 | 124 | 82,021 |
| Householder who is Some Other Race alone Map | 3 | 8 | 1,070 | 2,940,610 |
| Householder who is Two or More Races Map | 16 | 44 | 3,344 | 1,157,569 |
| HOUSING UNITS, OCCUPIED, TENURE BY HISPANIC OR LATINO ORIGIN OF HOUSEHOLDER | ||||
| Owner occupied: Map | 2,057 | 3,844 | 278,418 | 75,986,074 |
| Not Hispanic or Latino householder Map | 2,048 | 3,807 | 274,612 | 69,617,625 |
| Hispanic or Latino householder Map | 9 | 37 | 3,806 | 6,368,449 |
| Renter occupied: Map | 631 | 1,277 | 131,189 | 40,730,218 |
| Not Hispanic or Latino householder Map | 622 | 1,249 | 127,066 | 33,637,301 |
| Hispanic or Latino householder Map | 9 | 28 | 4,123 | 7,092,917 |
| HOUSING UNITS, OCCUPIED, TENURE BY HOUSEHOLD SIZE | ||||
| Owner occupied: Map | 2,057 | 3,844 | 278,418 | 75,986,074 |
| 1-person household Map | 530 | 1,097 | 66,631 | 16,453,569 |
| 2-person household Map | 1,057 | 1,834 | 118,084 | 27,618,605 |
| 3-person household Map | 223 | 426 | 38,883 | 12,517,563 |
| 4-person household Map | 129 | 245 | 32,324 | 10,998,793 |
| 5-person household Map | 73 | 138 | 14,473 | 5,057,765 |
| 6-person household Map | 23 | 63 | 5,172 | 1,965,796 |
| 7-or-more-person household Map | 22 | 41 | 2,851 | 1,373,983 |
| Renter occupied: Map | 631 | 1,277 | 131,189 | 40,730,218 |
| 1-person household Map | 274 | 583 | 55,144 | 14,751,340 |
| 2-person household Map | 147 | 298 | 35,891 | 10,624,023 |
| 3-person household Map | 89 | 164 | 18,163 | 6,240,422 |
| 4-person household Map | 58 | 107 | 12,083 | 4,626,453 |
| 5-person household Map | 41 | 82 | 5,993 | 2,480,866 |
| 6-person household Map | 12 | 23 | 2,391 | 1,108,903 |
| 7-or-more-person household Map | 10 | 20 | 1,524 | 898,211 |
Loading...